
October 19, 2026
We Added One Signal to a Trading Strategy - Here's What Changed
A real, reproducible before/after backtest from our open strategy-enhancer repo
"How much can DefiTheOdds actually improve my strategy?" is the question I get asked most, and it's a hard one to answer in the abstract - it depends entirely on your strategy, your pair, and your timeframe. So instead of answering it in the abstract, we built a small open-source repo that answers it directly: strategy-enhancer. Take any strategy, add exactly one DefiTheOdds field, and compare the backtest.
The baseline strategy
The repo ships with a classic golden-cross / death-cross strategy (strategies/base.js):
- Entry: SMA-50 crosses SMA-200 (golden cross for long, death cross for short), filtered by RSI-14 (long only if RSI ≤ 70, short only if RSI ≥ 30)
- Exit: RSI crosses back through its directional threshold, the opposite cross appears, or a fixed 2% stop-loss / 5% take-profit is hit
- Nothing exotic - the kind of strategy most people start with
The one-line change
The "enhanced" version (strategies/base_with_defiTheOdds.js) uses the exact same entry/exit logic, plus one extra condition before taking a trade:
function meetsDefiTheOddsEntryCriteria(candle) {
    return candle.expansion_probability > 0.6;
}
expansion_probability is one of the Core Alpha fields returned on every DefiTheOdds candle - the model's estimate that volatility is about to expand beyond its 20-day baseline (published ROC-AUC: 0.84 - see the full methodology). The enhanced strategy only takes a golden/death cross signal if DefiTheOdds also thinks a real move is brewing. No other parameter changed.
The backtest
Both versions were run against the same data: ETH-USD, hourly, 15,000 candles (Sept 21 2024 → June 15 2026), fetched from a single API call each.
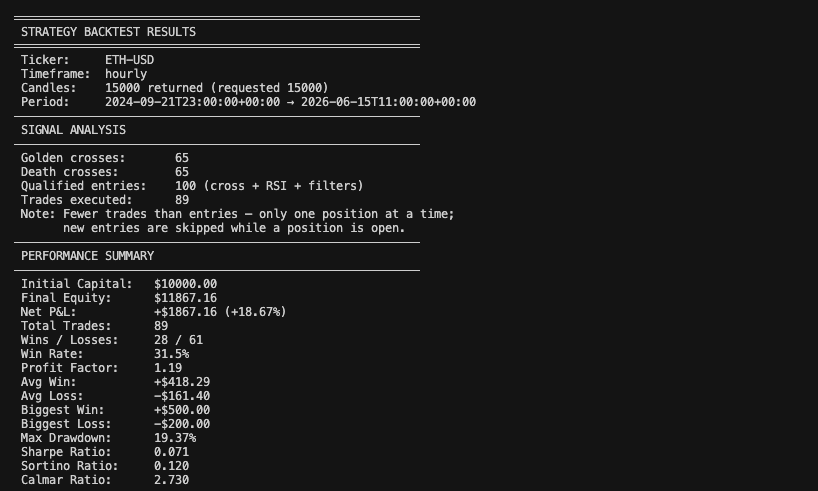
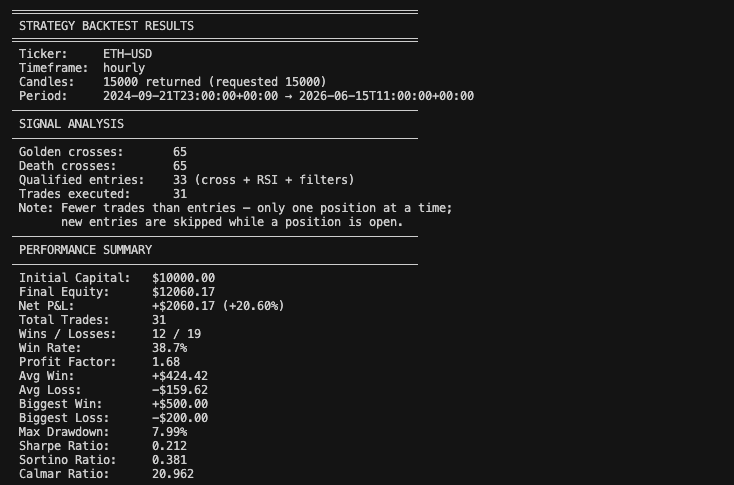
| Metric | Base strategy | + expansion_probability > 0.6 |
|---|---|---|
| Qualified entries | 100 | 33 |
| Trades executed | 89 | 31 |
| Win rate | 31.5% | 38.7% |
| Net return | +18.67% | +20.60% |
| Profit factor | 1.19 | 1.68 |
| Max drawdown | 19.37% | 7.99% |
| Sharpe ratio | 0.071 | 0.212 |
| Sortino ratio | 0.120 | 0.381 |
| Calmar ratio | 2.73 | 20.96 |
What actually changed
Notice what didn't change much: average win size ($418 vs $424) and average loss size ($161 vs $160) are nearly identical between the two versions. The signal isn't making individual trades bigger winners - it's filtering out 65% of the trades the raw cross strategy would have taken, and those filtered-out trades were disproportionately the bad ones.
The result: similar total return from a third of the trades, less than half the drawdown, and roughly 3x better risk-adjusted ratios across the board. That's the practical value of a volatility-expansion signal - it doesn't tell you which direction to trade, it tells you whether a signal is even worth acting on right now.
Try it on your own strategy
The repo is built so you can swap in your own entry/exit logic and run the same comparison:
git clone https://github.com/defi-the-odds/strategy-enhancer.git
cd strategy-enhancer
npm install
cp example.env .env   # add your free API key from defitheodds.xyz
cp strategies/base.js strategies/myStrategy.js   # write your own entry/exit criteria
node index.js
Get a free API key at defitheodds.xyz/register - the free tier covers BTC and ETH, which is all you need to reproduce this exact test.
Before you read too much into it
This is one pair, one 21-month window, one threshold (0.6), no fees or slippage modeled. It's a demonstration of how to measure whether a signal helps your strategy, not a guarantee that expansion_probability > 0.6 is the universally correct filter for every pair or timeframe. Run it on your own strategy and your own markets before trusting any single number - including these ones. Not investment advice.
(Longtime readers may recall an earlier post that showed a golden-cross backtest with a different headline result: +64.8% return and 32% drawdown. That was an earlier, less rigorous pass at the same idea, on different data. The numbers above are the current, reproducible reference - pulled straight from the open repo rather than a one-off run - and the ones we'd point you to going forward.)
Full source, both strategy files, and the raw backtest engine: github.com/defi-the-odds/strategy-enhancer. For the published accuracy numbers behind expansion_probability and the rest of the Four Horsemen / Core Alpha suite, see the methodology page.